In modern project environments, teams must process large amounts of information every day. Tasks, deadlines, workload distribution, and project progress all need to be monitored simultaneously. Without a clear system to visualize this information, managers often struggle to make informed decisions.
Project management dashboards solve this problem by transforming complex data into visual insights. These dashboards allow teams to track progress, identify potential delays, and evaluate productivity in real time.
Instead of relying on scattered spreadsheets or status updates, dashboards provide a centralized interface that displays the most important project metrics in one place.
This guide explains how project management dashboards improve operational visibility and help teams make better strategic decisions.
What Is a Project Management Dashboard
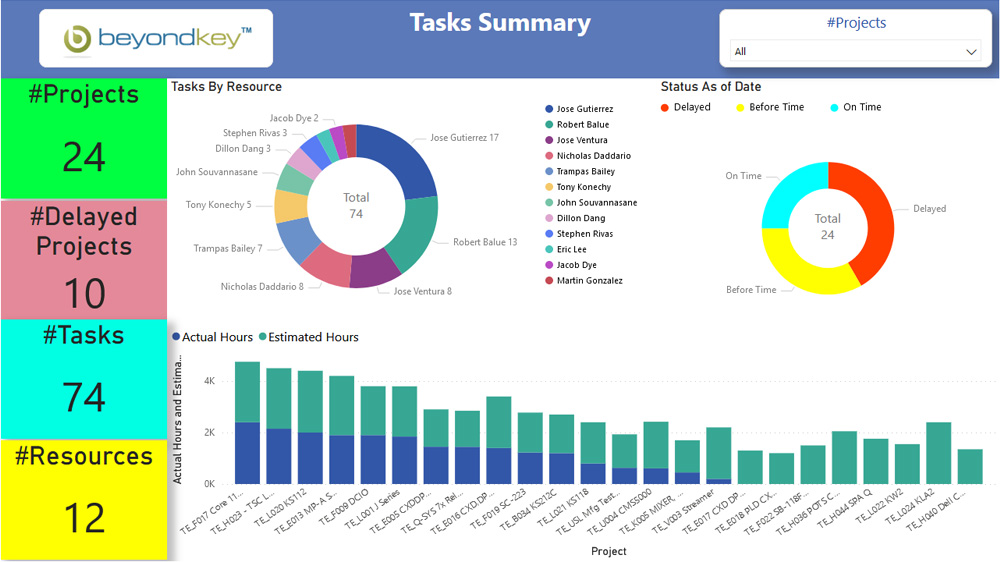
A project management dashboard is a visual interface that displays key project metrics in real time.
Typical dashboard elements include:
- task progress indicators
- workload distribution
- upcoming deadlines
- project milestones
- team productivity metrics
These insights help project managers quickly understand the current state of a project without reviewing multiple reports.
Teams that implement dashboard-based monitoring often reduce delays and improve project coordination significantly.
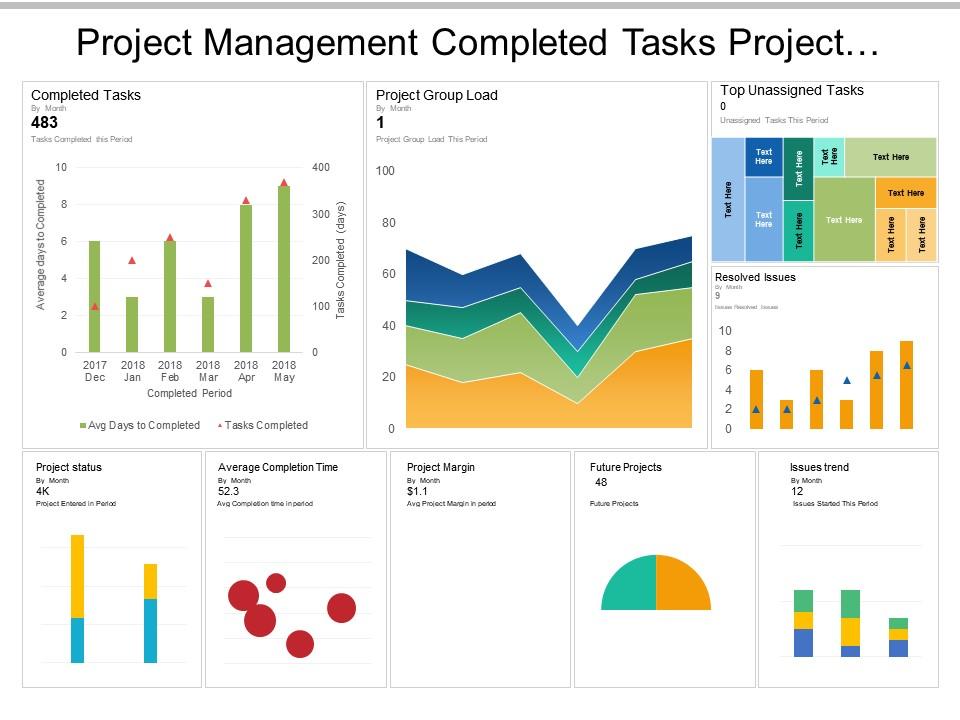
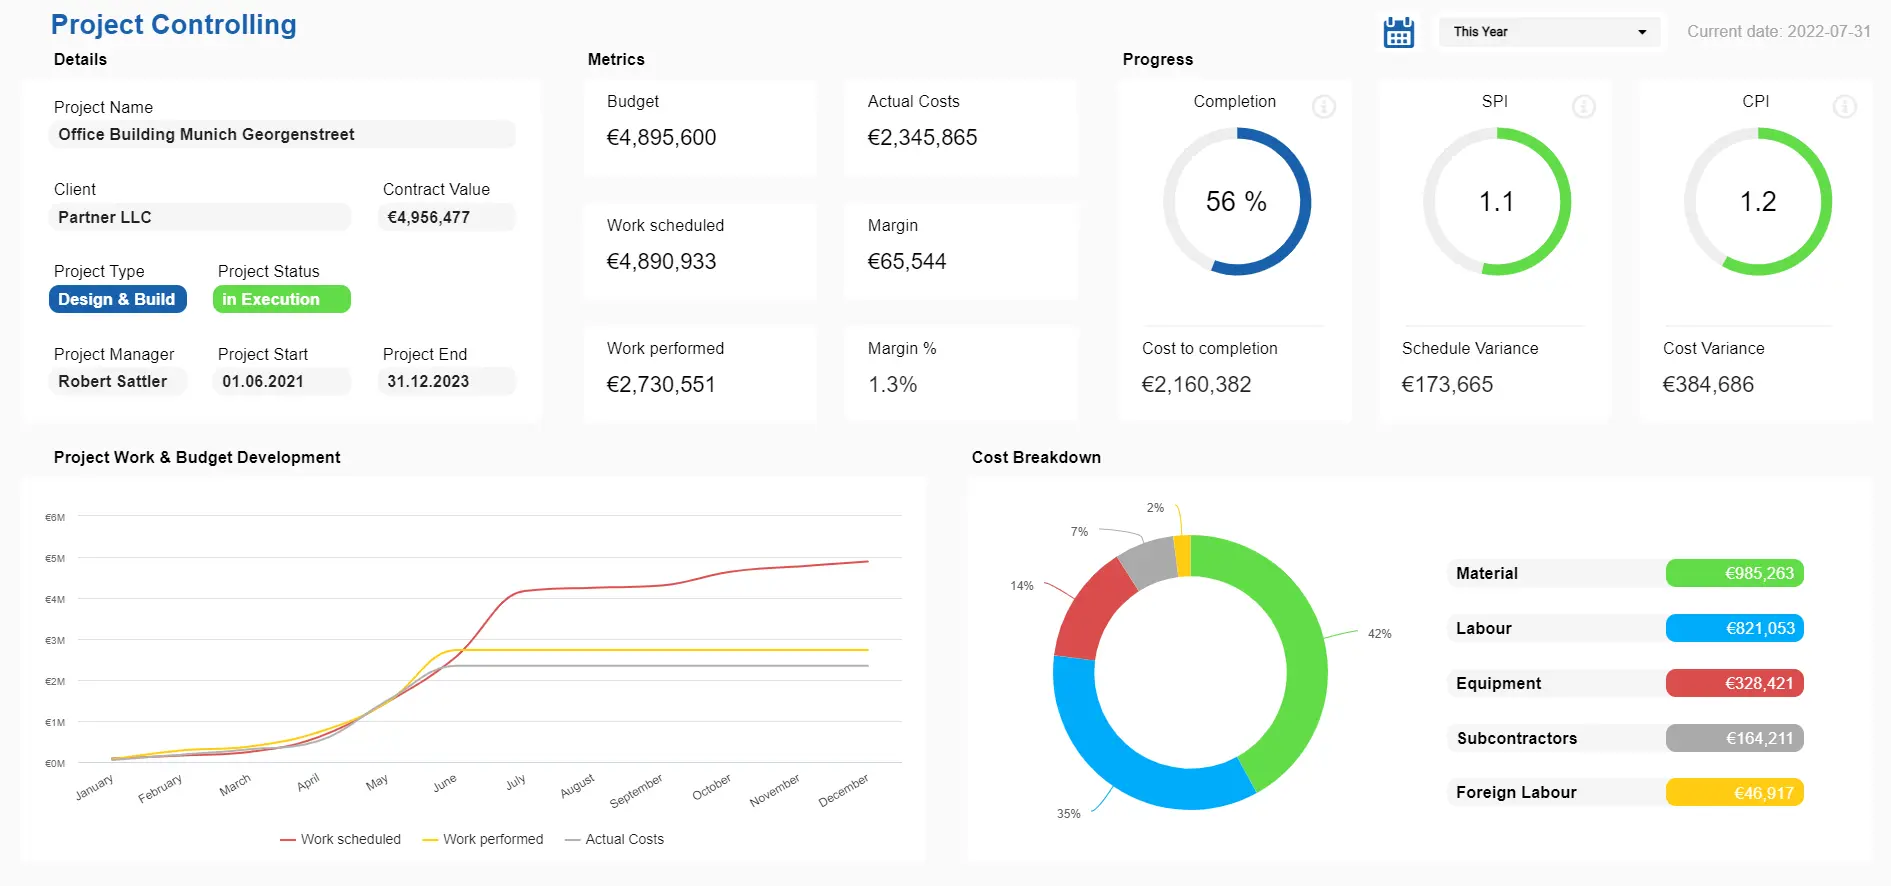
Visualizing Project Progress

One of the primary benefits of dashboards is the ability to visualize project progress.
Instead of manually reviewing tasks, dashboards present progress through visual elements such as:
- charts
- progress bars
- completion percentages
- timeline views
These visual indicators help teams immediately identify which projects are on track and which require attention.
Managers can quickly detect potential delays and adjust workflows before problems escalate.
This level of transparency significantly improves project coordination.
Workload Monitoring for Balanced Teams
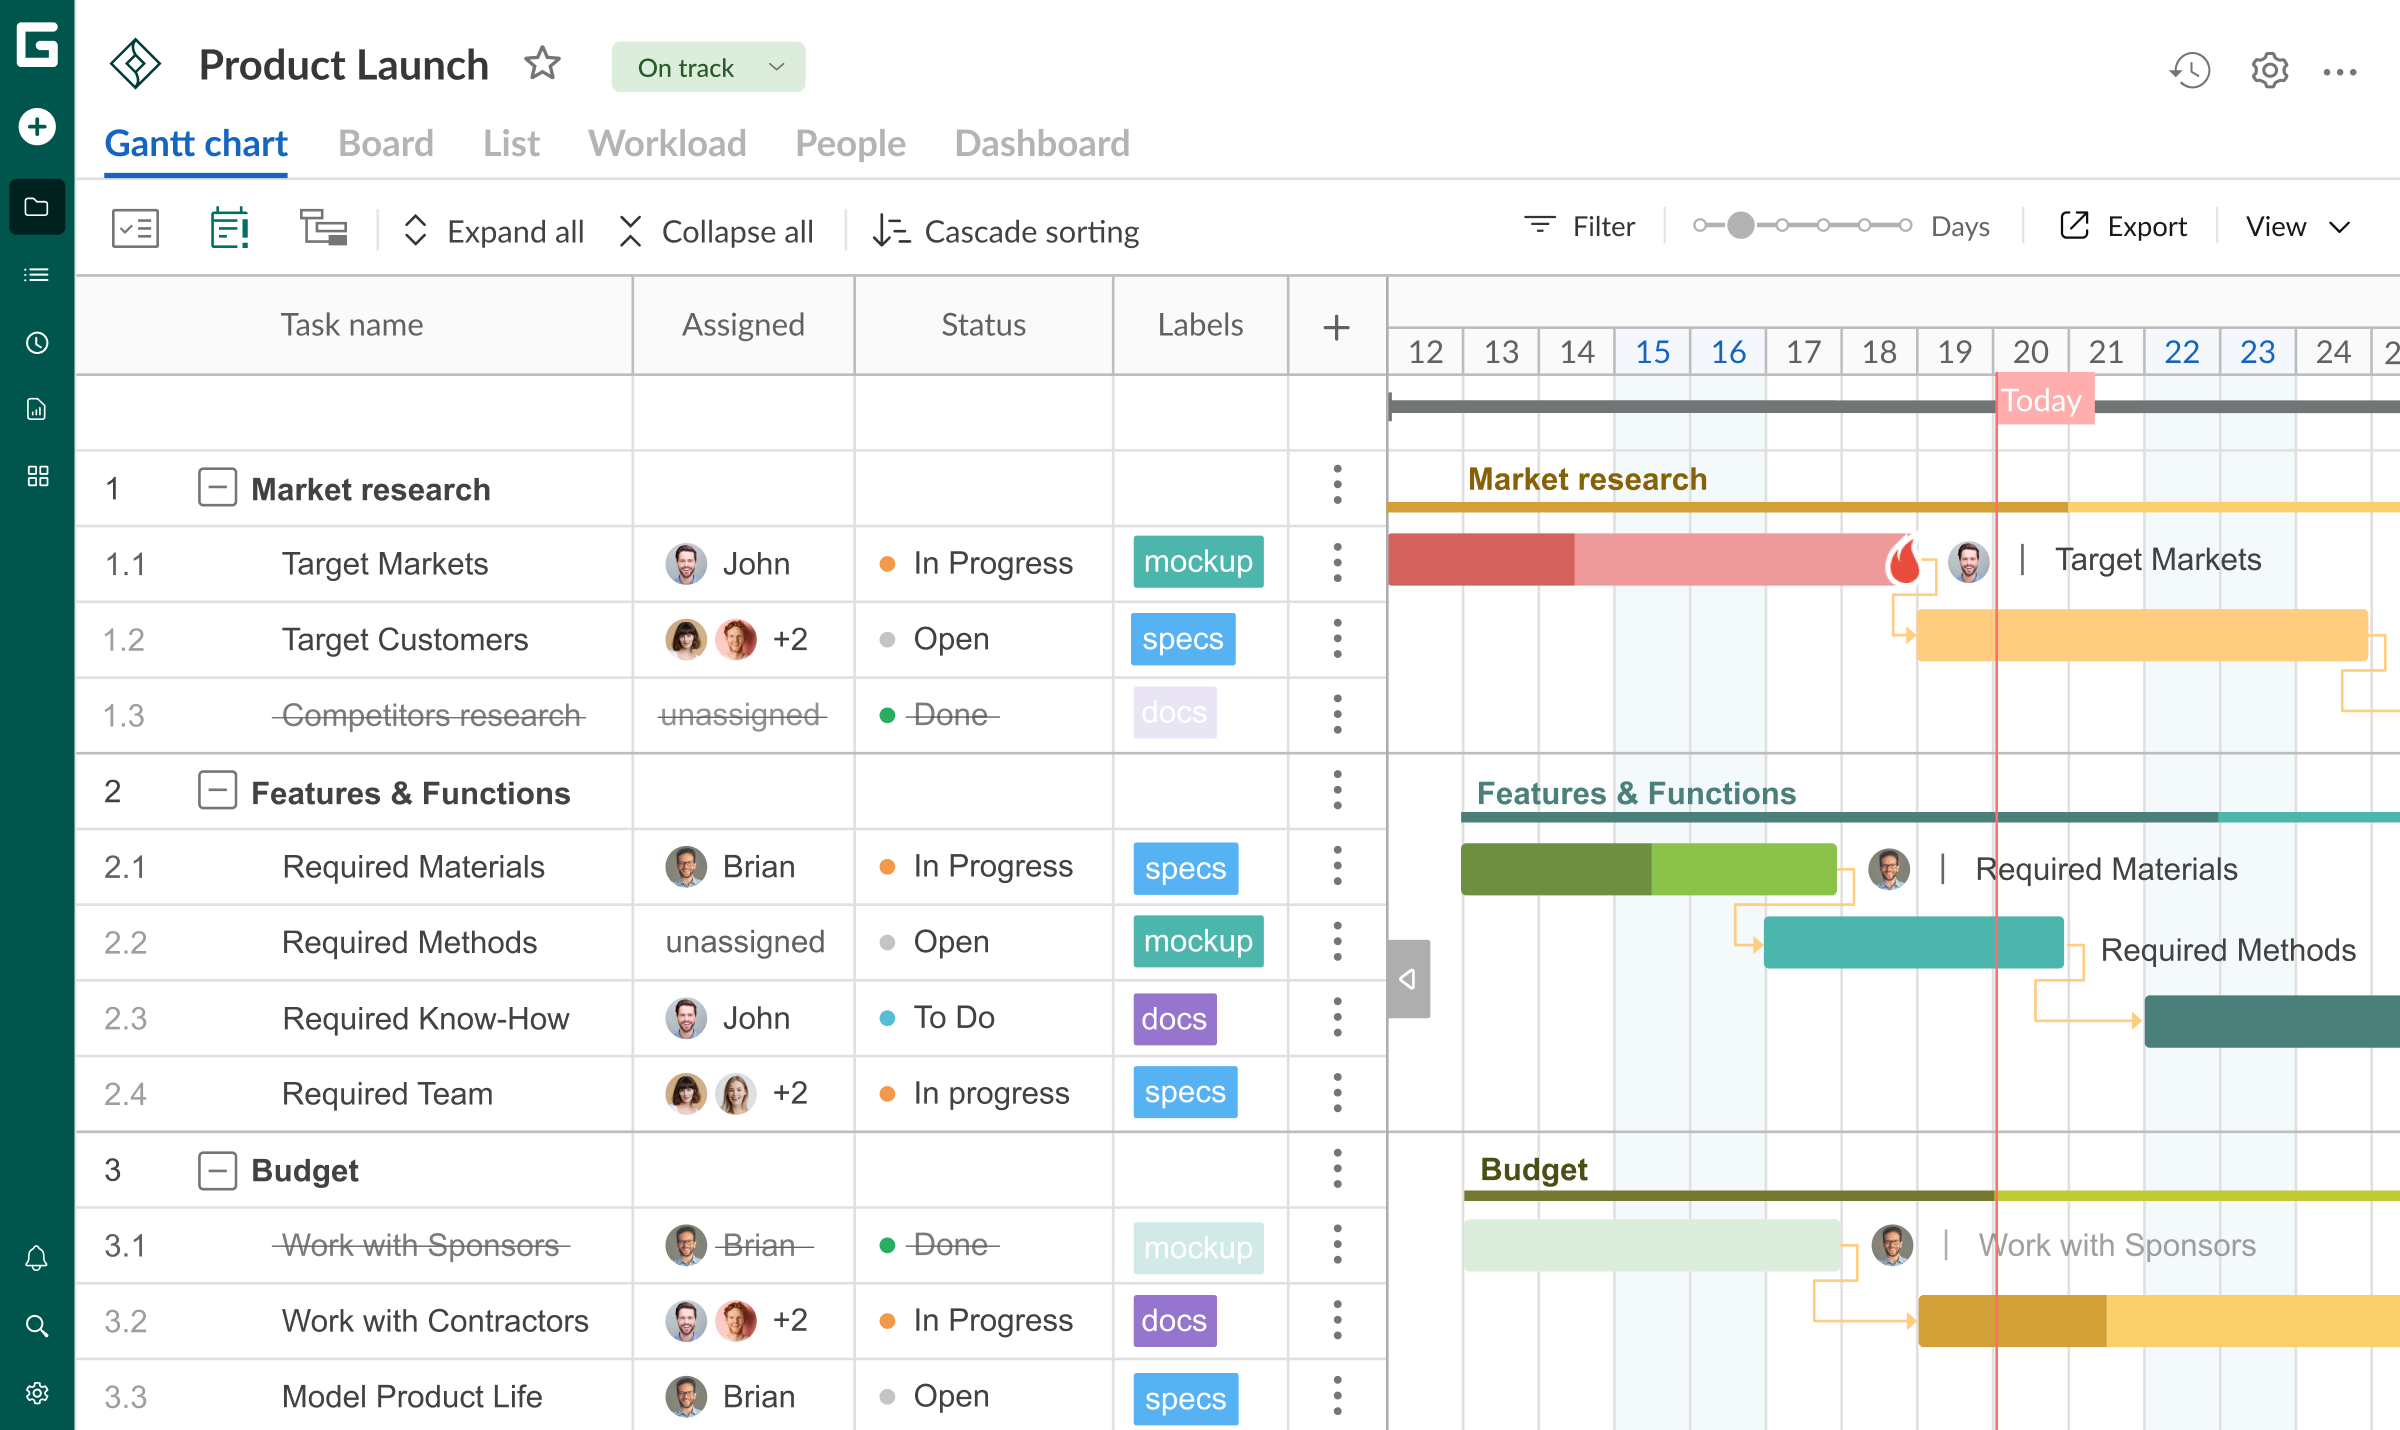
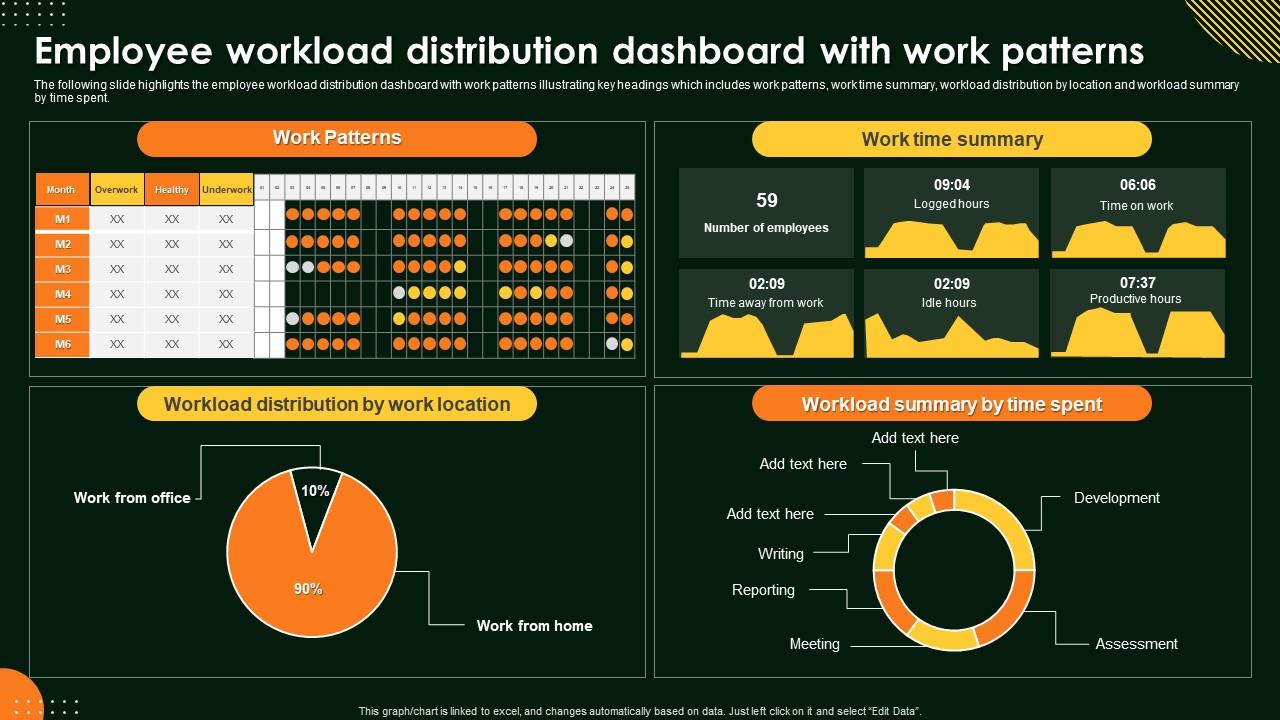
Dashboards also help managers analyze how work is distributed across a team.
Uneven workload distribution is a common cause of missed deadlines and employee burnout.
By visualizing workload metrics, managers can:
- identify overloaded team members
- redistribute responsibilities
- maintain balanced productivity
Balanced teams are more likely to maintain consistent project performance.
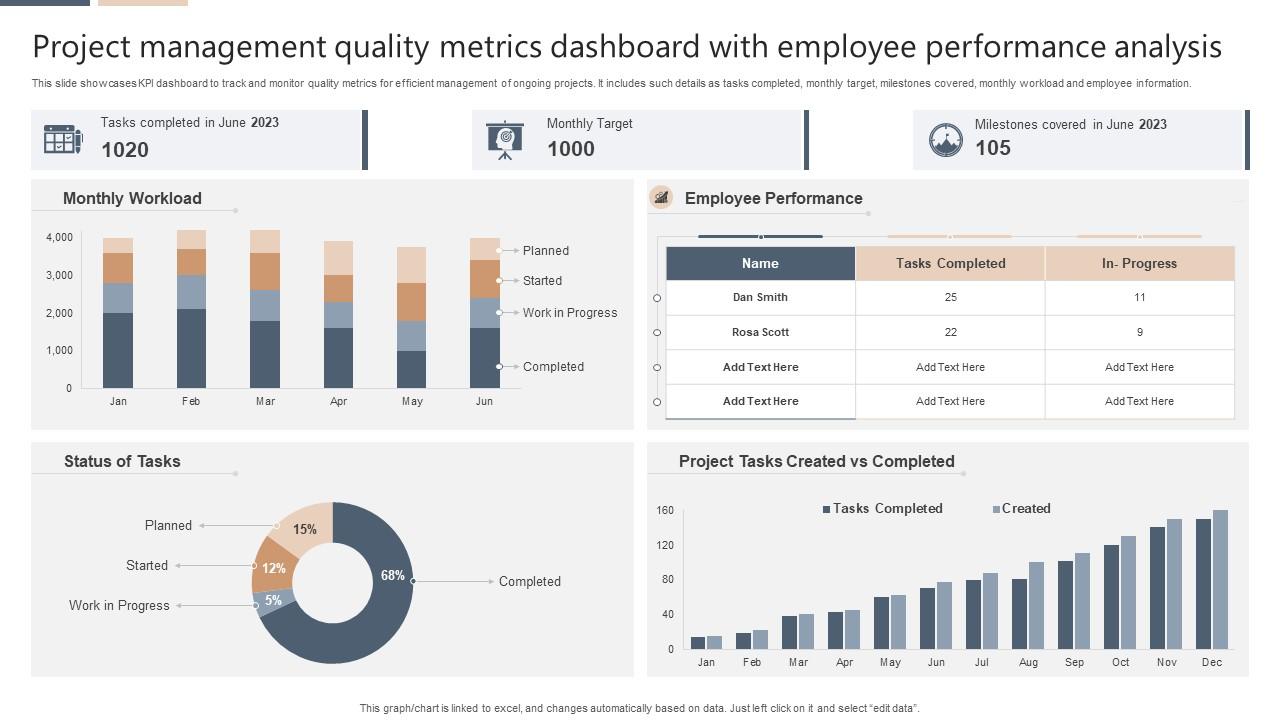
Data-Driven Decision Making

Project dashboards also support data-driven decision making.
Instead of relying on assumptions, managers can analyze real metrics such as:
- task completion rates
- productivity trends
- project velocity
- milestone progress
These metrics help leaders make informed decisions about resource allocation and project strategy.
Organizations that rely on data-driven project monitoring often achieve more predictable outcomes.
Early Detection of Project Risks
Another major advantage of dashboards is early risk detection.
Project dashboards highlight potential problems such as:
- delayed tasks
- blocked workflows
- resource shortages
When issues become visible early, teams can intervene quickly.
This proactive approach helps prevent minor issues from becoming major project failures.
Improving Team Communication
Dashboards also improve team communication.
Instead of constantly asking for status updates, team members can simply review the dashboard to understand project progress.
This transparency reduces unnecessary meetings and allows teams to focus on completing work rather than discussing progress.
Clear visibility helps everyone stay aligned with project goals.
Connecting Dashboards With Task Prioritization
Dashboards become even more powerful when combined with structured task prioritization systems.
Managers can quickly see which tasks require immediate attention and which projects are progressing smoothly.
Prioritization ensures that high-impact work receives attention first.
Final Thoughts
Project management dashboards provide a powerful solution for improving visibility and decision-making within teams. By transforming complex project data into clear visual insights, dashboards allow managers to monitor progress, detect risks, and allocate resources effectively.
Organizations that adopt dashboard-based project management often experience improved productivity, stronger collaboration, and more predictable project outcomes.
In modern workplaces where projects grow increasingly complex, dashboards have become an essential tool for maintaining operational clarity.